Audit Analytics
Audit Data Analytics
Data Visualization and Powerful Analytics for Auditors
“A picture is worth a thousand words.”
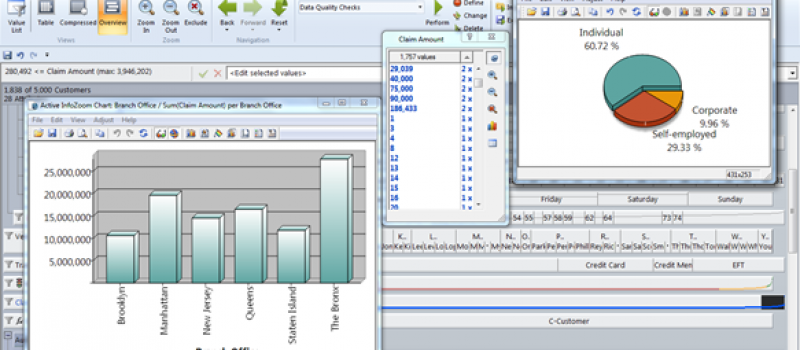
Using InfoZoom, you can identify outliers visually and quickly. InfoZoom’s unique data presentation makes interesting trends “pop-out”. In addition, investigation analysis can be presented through dynamic Dashboarding.
Unlike ACL, Idea, other CAATs tools, Qlik, or Tableau, InfoZoom provides advanced data visualization and analytics without the need for programming or scripting. No need to turn to costly customization or technical support.
Out-of-the-box visualization, dashboards, and overviews are inherent within the software tool.
Test InfoZoom free for 30 days!
Experience how quick and easy audit analytics can be!
Internal Audit Analytics
Data analysis for Internal Audit, Forensics and Investigations is unique and requires a different approach. You need to quickly identify patterns and outliers without being an expert in the data. Sometimes you don’t know exactly what you are looking for. InfoZoom helps overcome this big challenge. InfoZoom can complement tools like Excel, Tableua, ACL or other existing CAATs data analysis tools for Internal Audit.
Analyzing data with InfoZoom is simple. View your entire data at a glance, and get results in seconds. No programming or scripting necessary!
Examples of Audit and Fraud analysis:
- Vendor Analysis – Finding payment anomalies in vendors and identifying employees set up as vendors
- Duplicate Transactions – Finding unusual duplicate transactions
- Weekend Analysis – Determining activity occurring over a weekend or holiday
- Purchase Card (PCard) Analytics – Analyzing purchase card transactions for abuse and fraud.
- Loyalty Programs – Finding potential fraud and abuse in loyalty programs, such as Friends & Family or employee benefits analysis
- Warranty Analysis – Identify fraud in warranties, coupons, and product returns
- Continuous Audit – Schedule your audits to provide insights into audit data analysis automatically
- Aging Analysis – Analyze Accounts Payable or Accounts Receivables over time
- GAP Analysis – Analysis of any gaps, such as in PO payments, invoice or check numbers, insurance gaps and other gaps
Ultrafast, In-Memory Analysis
Get results in seconds.
InfoZoom is a completely in-memory solution which allows an auditor to immediately uncover hidden patterns in your data. With just a few clicks, audit and risk analysts can easily conduct investigations that previously would have taken hours.
Audit Data Analysis without the need for I.T.
Unlike other CAATs tools, the audit and investigation teams don’t need support from I.T. and database specialists to use InfoZoom. Unlike complex tools like Microsoft PowerBI, InfoZoom is a self-service in-memory solution that provides advanced analytics. Whether you are conducting ad-hoc research, routine analyses or continuous monitoring, you can always find the answers you need completely on your own.
InfoZoom is easy to learn and use. The software is lean and can be directly installed in business departments with minimal support.
In addition, no painstaking data preparation is required. Just load it and you are set to go.
All Your Data at a Glance
Whether the data you need is in a database, Excel spreadsheets, CSV files or fixed format text files, the import process is fast and intuitive. With just a few clicks, you can use the software tool to flexibly combine various types of data. And once they have been saved, the settings for your data sources can be reloaded at any time.
InfoZoom gains direct access to all types of databases, including Microsoft SQL Server, Oracle, DB2, Microsoft Access, Progress, and many other databases via ODBC.
Stratification is a major visualization technique that is used to identify anomalies and outliers. The data analysis software automatically stratifies your data immediately upon import. This capability allows auditors to see the patterns without programming or scripting.
Stoplights and Scorecards are often used to highlight certain patterns in data. For example, Red, Yellow, and Green colors are commonly used in Stoplighting to show data within certain limits or trending over time. Many customers assign there own color schemes to show additional conclusions for their analysis.
InfoZoom offers many additional visualization techniques that are integrated out-of-the-box.
Easy set up of Complex Calculations
Calculate relevant Key Performance Indicators with a single click. Thanks to multiple wizards and a simple formula language, you can even run complex time series, distribution analyses and statistical methods in no time flat.
A single click is all you need to display your results in Excel. You can even link charts and lists so that your reports stay up to date even when the analytic findings have changed.
Thanks to the various integrated export formats, you can easily process these insights further in other applications.
Sampling should never be a requirement, but occasionally sampling is needed to fit audit plans. The Random Sample function creates a new table based on a random selection of data. This allows you to create small random samples from a large volume of data for small analyses in advance.
Benford’s Law can have many applications in audit, criminal investigation, and fraud analysis, including in Forensic Accounting. Setting up a Benford Analysis is easy in InfoZoom. Using its In-Memory analytics, a % Share calculation is a breeze.
Many complex functions are available to choose from and are easy to set up. These functions are categorized in general themes:
- Fuzzy Matching
- Date Comparison Functions
- Logic Functions, including repeated functions
- Algebraic and Mathematical Functions
- Character Manipulation
- Latitude and Longitude Functions
- Many more…
Unique Audit Trail
The Audit Trail documents steps and can be compared to an auditing program. Based on the logged data, you can determine which user has performed which steps (actions) at which time. These audit trails can be developed and executed on multiple data sources.
Analyze Cloud-Based Data Sources
Have data scattered across different platforms and cloud providers? InfoZoom merges and joins data from multiple locations, including Cloud-based solutions, such as Amazon (AWS), Microsoft, Oracle, Google, or any cloud-provider.
Low-Risk and Easy Entry to Valuable Analysis
InfoZoom is easy to test. Much like Excel, InfoZoom installs directly on your computer. Internet access is not required.
A 30-day free trial allows users to try out the powerful analysis in audit risk-free. At an individual level, team level or corporate level, InfoZoom provides new capabilities for improving audit processes and testing.
InfoZoom can also be configured in a client / server architecture for a robust, scalable solution. Your data analytics investment can grow as your business needs grow.
Features of InfoZoom and the Risk Free Evaluation:
- Review 100% of your data in a patented Data Visualization Overview
- Completely in-memory and very fast
- Read-Only. InfoZoom does not modify your original data
- Audit-specific Pre-Packaged Queries
- Bring in multiple data sources together
- Automate your standard tests
Built for Data Analytics
The data analytics software is built for analyzing large amounts of data from multiple sources and technologies.
- Join – Join multiple data sources in-memory without creating a database
- Link – Comparing different data sources to see relationships
- SQL – InfoZoom creates the SQL so you don’t have too! If desired, custom SQL can also be created
- Merge and Append –Combine multiple data sources in multiple ways
- Integration –Integrate your data through an in-memory solution without the need for additional databases
Enabling Agile Data Analytics
InfoZoom allows users to engage in a “Discovery” approach to data analytics. No longer are you required to spell out your analysis plan beforehand. The Agile Data Analytics approach allows you to visualize your data first, then react to your findings. The unique visualization allows you to integrate an Agile Data Analytics approach to your investigation process methodology.
InfoZoom supports a “Self-Service Business Intelligence” approach to data analytics through the use of Data Visualization and Agile Data Analysis.
Cost Recovery
Are there opportunities within your organization for Cost Recovery? The unique data visualization of InfoZoom can provide a fresh look at the areas of revenue loss and cost recovery. The InfoZoom software tool has been leveraged as part of cost and revenue recovery efforts for decades.
Pre-Packaged Queries
Getting sophisticated analytics up and running quickly is the goal of InfoZoom Pre-Packaged Queries. These common audit analysis needs are pre-configured and pre-packaged for easy installation with immediate results. Common analysis, such as Purchase Order and Invoice Date comparisons are developed to be easily installed through a Windows Wizard. Best of all they are provided for free to customers!
Key Word Search
InfoZoom is an in-memory solution. Another advantage of being in-memory is the ability to perform global searches on key search terms. This software tool functionality is often required for criminal investigations, privacy analysis and audit data analytics.
Key words can be quickly identified, including:
- Social Security Numbers & Tax ID Numbers
- Commonly Used Terms to Identify Fraud
- External Email Accounts, such as gmail, Yahoo, hotmail, etc.
- Social Media Access
- Visits to Suspicious Websites
- Device & Computer PC Usage
- Many more…


